Climatogram of a Temperate Rainforest
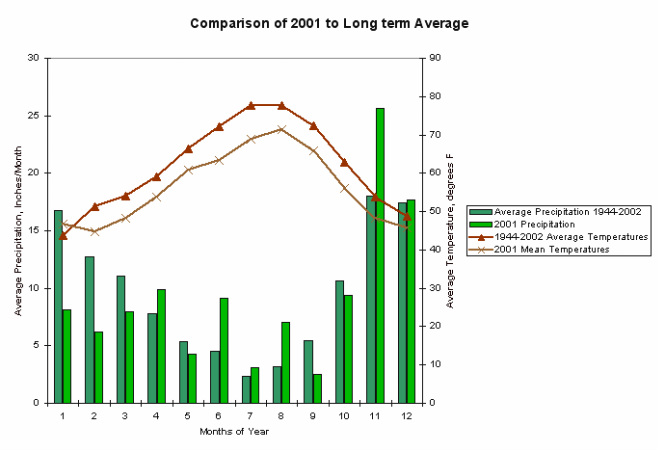
The graph above is a climatograph of a temperate rainforest, measuring average precipitation and temperatures from 1944-2002 and 2001. Around summer, precipitation decreases while temperatures increase, while precipitation increases and temperatures decrease around November and December. Thus, temperature and precipitation levels are inversely related in this biome. Because the precipitation is so high the rainforest's plants and trees are abundant and provide food and habitats for animals.
